
Average Family Expected Revenue report
Track how much each family is expected to spend per season, review trends over time, and drill into specific families from the Average Family Expected Revenue report.
What the report shows
Average Family Expected Revenue Over Time estimates how much revenue you expect from each family in a season, then tracks how that average changes over time and across seasons.
Use this report when you want to:
-
Compare how much families are expected to spend from one season to the next.
-
Spot seasons where family spend is trending up or down.
-
Drill into which families drive a season's expected revenue.
The report calculates expected revenue based on your product setup and applied discounts/credits. It does not show collected or deposited revenue; use financial reports such as Revenue Summary or Deposit Summary for actual payments.
How expected revenue is calculated
Expected revenue in this report uses the same definition shown in the Campium UI.
Expected revenue is calculated as the sum of the product prices minus discounts and credits.
For each season:
-
Campium adds up the prices of all products on a family's account.
-
Campium subtracts any discounts and credits applied to those products.
-
The result is the family's expected revenue for that season.
Average Family Expected Revenue for a season is:
- Total expected revenue for that season ÷ number of families with a balance in that season.
This matches the avg_balance value in the underlying report data, where:
-
total_balance= sum of expected revenue for all families in the season. -
family_count= number of families included in that season's calculation. -
avg_balance=total_balance / family_count.
Permissions and access
You need the finance module permission to view this report.
If you do not see Average Family Expected Revenue Over Time in the Reports area, an administrator must enable the finance module permission for your staff account. See Allow a staff user to see a report.
The report lives at the internal URL /report/average-family-spend.php and appears in your Reports area as Average Family Expected Revenue Over Time.
Run the report
Use these steps to open and run the report from Campium.
Open the System Reports area
-
Sign in to the admin side of Campium.
-
Go to your Reports section.
-
Open the System or System Reports group, depending on your navigation.
You should now see a list of built-in system reports.
Open Average Family Expected Revenue Over Time
-
In the System Reports list under Charts, look for Average Family Expected Revenue Over Time.
-
Select the report name to open it.
The report page loads with all seasons selected and the charts ready to populate.
Apply the season filter and load data
-
Use the Season multi-select filter at the top (labeled
season-selectin the code). -
Keep the default of all seasons selected or pick specific seasons you want to analyze.
-
After adjusting the seasons, run or refresh the report if the page does not auto-refresh.
When the data loads successfully, you see:
-
A line chart for the trend over time.
-
A bar chart by season.
-
Summary cards with key averages.
-
A season breakdown table.
If you arrive at the report from a dashboard or a link with a pgcryid in the URL, Campium may pre-select a season or context for you. You can still change the Season filter to broaden or narrow the results.
Filters
The Average Family Expected Revenue report has a single primary filter.
Season filter
The Season filter controls which seasons appear in the charts and season breakdown.
-
The filter is a multi-select list of seasons.
-
All seasons are selected by default when you load the page.
-
Clearing or deselecting all seasons results in an empty chart and table.
When you change the Season filter and run the report, Campium sends the selected seasons (along with your agency) to the server to recalculate the averages.
URL context and pgcryid
You may sometimes see a pgcryid value in the URL when you open the report from another area, such as a dashboard widget or shortcut.
-
pgcryidtells the report which context or saved view you came from. -
The report still honors any seasons you set in the Season multi-select.
-
You can safely ignore
pgcryidunless you are debugging a custom link or integration.
What you see on the page
After you run the report with at least one season selected, the page shows a combination of charts, summary cards, and a detailed table.
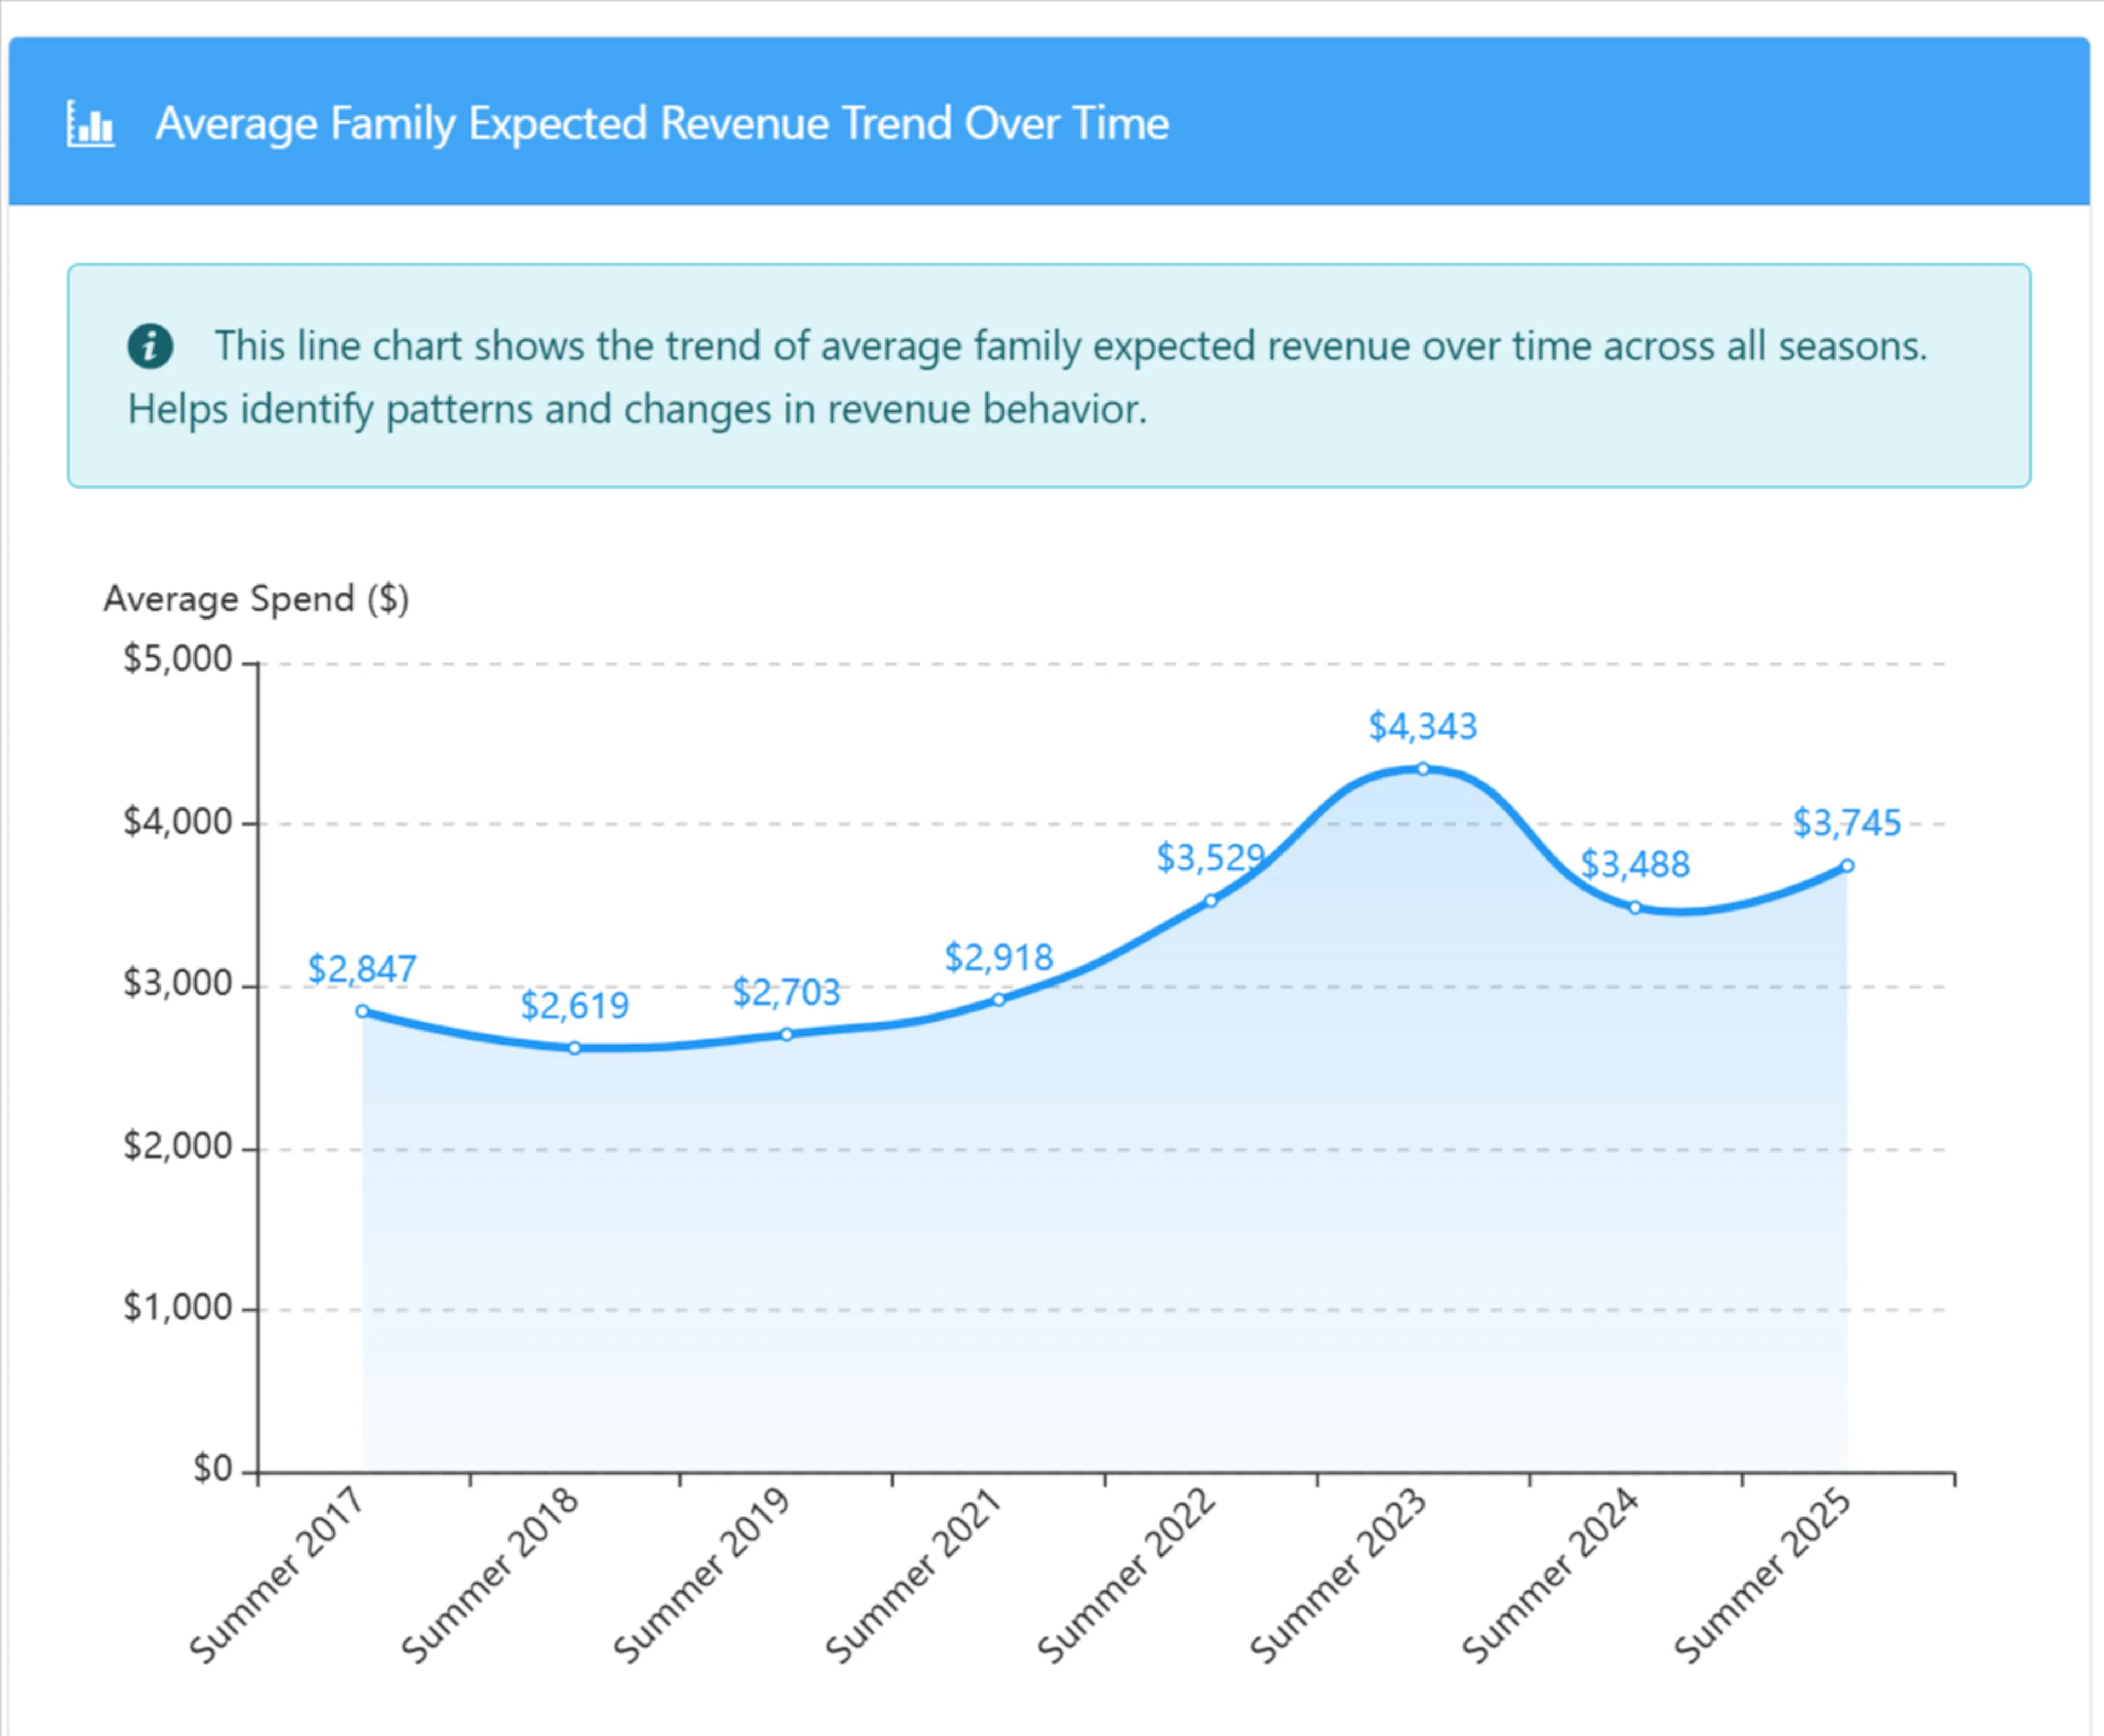
Average Family Expected Revenue Trend Over Time (line chart)
The line chart at the top is labeled Average Family Expected Revenue Trend Over Time.
This chart shows:
-
The average expected revenue per family on the vertical axis.
-
Seasons or time points on the horizontal axis.
-
A line that connects each season's average expected revenue.
You can use this view to:
-
See whether average spend per family is going up or down across seasons.
-
Spot sharp increases or drops that might align with pricing changes, new programs, or discount policies.
The points on the line chart are clickable and correspond to individual seasons.
Average Family Expected Revenue by Season (bar chart)
The bar chart is labeled Average Family Expected Revenue by Season.
This chart displays:
-
One bar per season included in your Season filter.
-
The height of each bar representing the average expected revenue per family for that season.
Use the bar chart to:
-
Compare seasons side by side at a glance.
-
Identify outlier seasons with much higher or lower average expected revenue.
-
Confirm the pattern from the line chart in a more categorical view.
Each bar is clickable and leads to the same season breakdown as clicking a season in the table.
Summary cards
Above or near the charts, you see summary cards that highlight key metrics:
-
Current Average: The average family expected revenue for the most recent season in your selection.
-
Highest Average: The season with the highest average expected revenue per family.
-
Lowest Average: The season with the lowest average expected revenue per family.
-
Trend: The change in the most recent season compared to the prior season (for example, up or down as a percentage or amount).
Use these cards as a quick readout before digging into the detailed table:
-
If the Trend card shows a negative change, look for reasons families might be spending less (pricing, fewer sessions, more discounts).
-
If the Highest Average is a past season, compare what was different about that season's offerings or pricing.
Trend compares the newest season in your filter to the prior season in the same filtered set. If you limit the Season filter to a small set of seasons, you may see a different trend than when all seasons are selected.
Season breakdown table
Below the charts, the season breakdown table lists each season with its key metrics.
The table includes these columns:
-
Season
The name of the season. The Season cell is clickable and opens the family-level drill-down for that season. -
Average Expected Revenue
The average expected revenue per family for that season. The cell also shows a percentage change vs the prior season so you can quickly see whether family spend increased or decreased. -
Number of Families
How many families are included in the average for that season. This count is the denominator in the average calculation. -
Total Balance
The total expected revenue for that season across all included families. This is the sum of each family's expected revenue (product prices minus discounts and credits).
For a given season, you can interpret the numbers as:
-
Total Balance ÷ Number of Families = Average Expected Revenue.
-
The percentage change compares this season's average against the previous season's average.
The season breakdown table always reflects the seasons currently selected in the Season filter. If you deselect older seasons, the "prior season" used for percentage comparisons may change.
Drill down to families
Clicking into a season opens a modal that shows which families contribute to that season's expected revenue.
Open the families modal
Choose a season
-
In the season breakdown table, locate the season you want to inspect.
-
Select the Season name link for that row.
Campium opens a modal window with a list of families for the chosen season.
Review families and their expected revenue
Inside the modal, you see a table with:
-
Family Name: The primary family name. The name is a link that opens the family profile in a new tab at
/profile/?an=account_number. -
Expected Revenue: The expected revenue for that family in the selected season (product prices minus discounts and credits).
-
Number of Participants: How many participants from that family are registered for that season.
Use this view to understand which families drive high or low averages and to investigate specific accounts.
Use the Family Name link to open the profile in a new browser tab, so you can review charges, discounts, and payment history without losing your place in the report.
Interpreting and using the data
Average Family Expected Revenue helps you answer planning and pricing questions:
-
Pricing impact: If average expected revenue per family jumps after a pricing change, confirm that the increase aligns with your goals and enrollment levels.
-
Discount strategy: A drop in average expected revenue might reflect more aggressive discounts or scholarships. Compare changes in Total Balance and Number of Families to see whether the drop is due to pricing or enrollment.
-
Enrollment mix: If the Number of Families grows but the Average Expected Revenue stays flat, you may be adding families with lower spend (shorter sessions, fewer add-ons).
Remember that this report looks at expected revenue, not actual payments collected. Use it alongside payment-focused reports when making financial decisions.
Troubleshooting empty or missing data
If the charts or table are empty, or you see less data than expected, check these common causes.
-
Confirm that you have at least one season selected in the Season filter.
-
If you recently created new seasons, verify that they have enrollments or products that generate expected revenue.
-
Try expanding the Season filter to include more seasons and run the report again.
-
Make sure your staff account has the finance module permission.
-
Ask an administrator to review your permissions or compare them to another user who can see financial reports.
-
If you still cannot find it after permissions are updated, confirm whether your organization uses this report and whether it has been enabled.
-
Check whether those seasons have any families enrolled or charges created.
-
Review discounts and credits applied; heavy discounts can reduce expected revenue toward zero even with participants enrolled.
-
Open the families modal for that season to see whether any families appear and inspect individual accounts.
-
Review which seasons are selected in the Season filter; the "prior season" for comparisons depends on which seasons are included.
-
Confirm that you are comparing Average Expected Revenue (per family) rather than Total Balance; a higher total with many more families can still produce a flat or lower average.
-
Cross-check with Revenue Summary or other financial reports if you are looking at collected payments rather than expected charges.